
Ad Market Opens 2026 On Steady Ground As Digital Leads Gains.
- Inside Audio Marketing

- Mar 4
- 2 min read

The ad market started out the year with a small in total spending, but it was the smallest gain in more than a year. Guideline reports overall ad spending increased 0.2%. And spending was down 28% month-to-month reflecting the annual page turning from one of the busiest months of the ad year gave way to a month with some of the lightest ad loads.
The monthly update shows ad categories beyond the top 10 were essentially flat from a year earlier, with spending increasing 0.1% in January. By contrast, top 10 ad category spending climbed 1% year-to-year.
Guideline doesn’t release radio-specific figures, but its monthly update offers a larger view of the overall ad environment by combining radio spending with other marketing activity. It shows that in January, two-thirds of ad spending was directed toward digital. That was down from digital’s 73% share in December. Despite capturing a smaller share of oval dollars spent, digital ad spending increased 7.6% in January compared to a year earlier. Traditional media spending declined 10.3% year-to-year.
Guideline expects U.S. ad spending to be “front-loaded” in 2026. It is forecasting overall grow of 4% this year, but says major global evens will drive momentum in the first half while macroeconomic pressure and midterm election volatility will tighten pacing into the year-end. It forecasts first-quarter spending will rise 8.4%, followed by gains of 4.3% in the second quarter, 3.6% in the third, and 0.7% in the fourth. In a social media post, it tells advertisers not to plan their media spending off the annual average. “The takeaway: don’t plan off the annual average. Early commitments matter. Late-year flexibility will be critical,” it cautions.
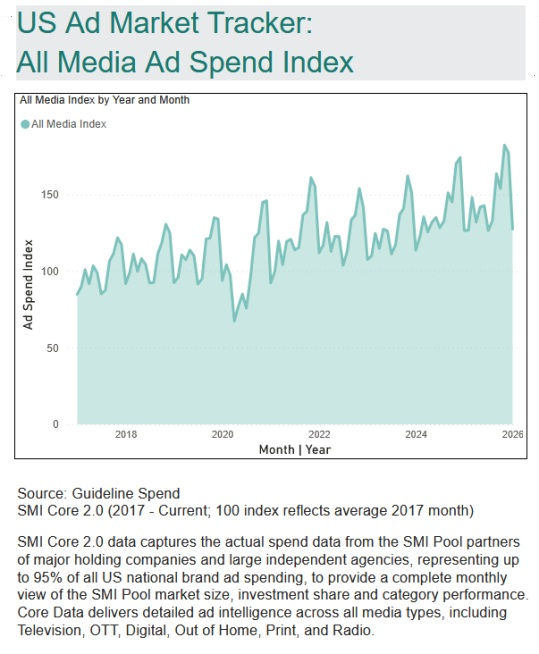
Guideline’s U.S. Ad Market Tracker is a composite monthly index from Standard Media Index, designed to provide a real-world measure of U.S. ad spending, based on actual invoiced media buys, including radio, from the major agencies and their clients. As such, it is mostly representative of spending by larger national advertisers.
The data is powered by SMI and covers radio, television, digital, print, and out-of-home media types. It is based on actual spending data from the SMI pool partners at major holding companies and large ad agencies, representing 95% of all U.S. national brand ad spending.
See Guideline’s U.S. Ad Market Tracker HERE.


Comments